
| Takeaway | Detail |
|---|---|
| More placements do not prove more visibility. | Even a hypothetical 25% increase in independent-restaurant placements would require measured views to establish an exposure gain. |
| Popularity is a baseline, not an exposure measure. | A proposed 90 days of evaluation should measure search-result views and clicks directly; Orbital’s Google-review growth metric measures popularity instead. |
| Exposure-aware ranking needs a diner-response guardrail. | An illustrative 25% relative gain in independent-restaurant view share would not justify a material decline in diner response. |
| Brand caps are only conditionally admissible. | A proposed 90 days of comparison should test whether limiting repeated brands improves independent visibility without materially weakening diner response; neither supplied source establishes that outcome. |
Even a hypothetical 25% increase in independent-restaurant placements would not prove that diners saw—or clicked—more independent restaurants. Matador Network’s supplied list ranks independents using Yelp ratings, with review counts breaking ties. It does not measure search-result exposure. Orbital’s supplied post tracks Google-review growth, another signal that cannot substitute for views or clicks.
From Lucas Moreau’s recommender-systems perspective, fair discovery is an exposure-allocation problem, not merely a question of which restaurants deserve high ratings. The policy choices are popularity-based ranking as a baseline, exposure-aware reranking that accounts for independent visibility, and limits on repeated chain brands. Each must be judged by what diners actually encounter and how they respond. Filling more positions with independents can change the list without meaningfully changing attention.
Caps therefore belong in the conditional category, not the default fairness toolkit. A proposed evaluation lasting 90 days could compare these policies using independent-restaurant view share and click-through rates, with a predefined guardrail against materially weaker diner response. That duration is a suggested test window, not a finding from either source. A cap is defensible only if measured independent visibility improves while diner response remains within that guardrail.
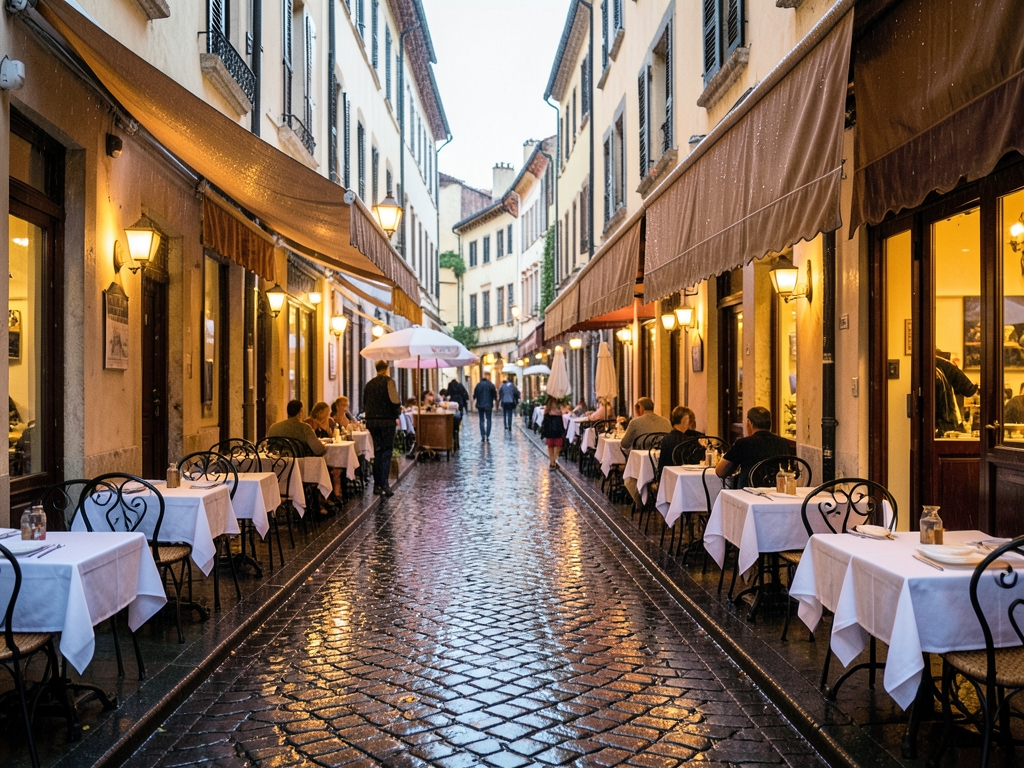
Count Viewed Restaurants, Not Slots
Replacing a chain location below the fold changes the ranking, not necessarily discovery. More independent restaurants in the top 10 does not automatically mean more independent restaurants were seen. For this guide’s comparison, the cap wins only when randomization demonstrates increased independent-restaurant view share while restaurant-detail click-through remains within a predeclared non-inferiority margin; otherwise, popularity-only ranking remains the choice.
According to Google Business Profile Help’s “Tips to improve your local ranking on Google,” local results depend mainly on relevance, distance, and prominence. Relevance concerns how well a Business Profile matches the search; distance concerns proximity to the searcher’s location; prominence concerns how well known a business is, including signals such as links and reviews. That documented mechanism is not this guide’s experimental reranker. Google’s explanation does not establish an independent-restaurant quota, nor does it describe local ranking as popularity alone.
Define popularity-only ordering as sorting eligible restaurants by a historical engagement score. The treatment reranks the identical eligible candidate set, imposing a predeclared maximum number of locations per chain brand within the top-10 prefix and preserving score order where the constraint permits. Freeze the score definition, historical measurement window, and tie-breaking rule across arms. Cuisine, opening-hours, and geographic eligibility remain hard constraints: the cap cannot admit an otherwise ineligible restaurant to fill a vacancy.
Assign ownership labels before ranking. According to Matador Network, independent restaurants are non-franchise or non-chain businesses that are locally owned and operated or family owned and operated. Turn that description into an explicit ownership-and-brand rule: qualifying local or family ownership must coexist with neither chain nor franchise affiliation. Classify franchise locations consistently under their chain brand, even when the franchisee is locally owned. Unresolved ownership stays unknown, not independent; maintain a shared brand identifier so spelling variations do not evade the cap.
A geographic label cannot establish ownership. According to Tripadvisor, its “THE 10 BEST Restaurants in Independence (Updated 2026)” concerns the place named Independence, not an independently owned restaurant category. That is a useful taxonomy edge case: neither a search phrase nor a list title substitutes for ownership-and-brand evidence.
Independent top-10 view share equals qualifying viewed independent cards divided by all qualifying viewed restaurant cards in positions 1–10. Chain and unknown cards both remain in the denominator. Before assignment, fix the minimum visible fraction of a card and the uninterrupted visibility duration required for qualification, identically across arms. A rendered card below the fold does not qualify without scrolling into view; an initially visible card can qualify without scrolling. Count each card once per result-list instance rather than counting repeated viewport entries.
Restaurant-detail CTR equals qualifying card impressions that produce a restaurant-detail click divided by all qualifying viewed cards, using that same top-10 scope. Independent-card CTR uses only qualifying independent impressions in both numerator and denominator. Fix the click-attribution window and count each qualifying impression as clicked or not clicked, deduplicating repeated clicks. Historical click-based popularity can reinforce exposure: higher positions attract more attention, generate more clicks, and thereby support future high placement. An aggregate CTR decline therefore does not establish a preference for chains. Lock these event definitions before randomization so the comparison measures viewed exposure and click performance rather than instrumentation differences.

Read the 5
Michael Luca’s Yelp research supports treating independent and chain restaurants differently when interpreting discovery signals; it does not establish that a chain-brand cap improves ranking. According to Luca’s “Reviews, Reputation, and Revenue: The Case of Yelp.com,” Harvard Business School Working Paper 12-016, revised 2016, a one-star increase in Yelp rating produces an estimated 5–9% increase in restaurant revenue. The outcome is revenue—not search views, restaurant-detail clicks, or click-through rate. For ranking design, that distinction separates evidence that reputation affects business performance from evidence that a particular ordering policy improves discovery.
According to Luca, the estimated rating effect is driven by independent restaurants and is not detected for chain-affiliated restaurants. This is the finding most relevant to merchant-facing discovery infrastructure: the same kind of reputation signal can have different business consequences across merchant types. A plausible information mechanism is that a chain’s established brand already tells diners something about what to expect, whereas an unfamiliar independent restaurant has more uncertainty for reviews to resolve. That interpretation motivates examining merchant types separately; it does not turn merchant type into a sufficient reason to promote an otherwise less relevant result.
The chain result also requires statistical restraint. An effect not detected for chain-affiliated restaurants is not proof that every chain location is immune to reviews, or that diners intrinsically prefer independent restaurants. Nor does the independent-restaurant result imply that additional exposure would reproduce the estimated revenue gain. A rating change alters information about a restaurant; a ranking change alters where an eligible restaurant appears. Treating those as interchangeable interventions would import an effect estimate into a mechanism the paper did not evaluate.
According to Luca, the restaurant-revenue records came from the Washington State Department of Revenue and covered 2003–2009. These are observed restaurant business outcomes, not a survey asking diners whether they support local businesses. That makes the evidence consequential: the measured response concerns commercial activity rather than declared preferences. But revenue remains a downstream outcome. It cannot be relabeled as evidence about which search results were viewed or whether restaurant-detail click-through remained acceptable.
According to Luca, chain restaurants also lose market share as review-platform penetration increases. This broader information-channel result is consistent with reviews reducing the informational advantage of an established brand. It concerns a market in which access to restaurant information changes—not merely a different ordering of already eligible results. A relevance-qualified chain-brand cap is the narrower intervention: it changes ordering without necessarily changing ratings, review availability, or diners’ familiarity with the platform.
Use Luca’s findings to justify testing for different responses across merchant types, not to declare the cap the winner. They cannot establish that any aggregate click-through decline reveals a preference for chains. The cap still requires randomized evidence of increased independent-restaurant share of actually viewed leading results and restaurant-detail click-through within the predeclared non-inferiority margin; otherwise, retain popularity-only ranking.
Compare Three Ranking Policies
Three ranking policies are on the table in 2026, and only one is conditionally admissible. The decision is not which policy is fairest in principle — it is which one survives a randomized comparison against the popularity-only baseline it would replace. Popularity-only ordering carries no explicit chain-brand limit, so historical engagement can concentrate visibility on a handful of brands. A fixed independent quota reserves positions by merchant category, which sounds decisive but can force weak matches when eligible supply is thin. The relevance-qualified chain-brand cap limits repeated brands only within eligible candidates — and it wins only after the exposure and click guardrails pass.
Cap strength should come from the observed distribution of repeated brands within restaurant result lists, not from a round number someone likes. Pull the distribution of how many slots a single brand occupies per query class, then set candidate cap strengths at meaningful points along that distribution — the median, the upper quartile, the tail. That discipline separates a defensible policy from a screenshot. A cap chosen because it produces an attractive-looking independent share in one captured result page is a curve-fit to a single query and will not replicate. According to Tripadvisor, its Independence restaurant-ranking description treats individual attributes "such as price range, cuisine and location" as the relevance signal — which is precisely why the cap must be relevance-qualified rather than category-quota'd. A quota ignores whether the independent candidate actually matches the diner's intent.
Run stable diner-level randomized assignment where feasible. The same diner sees the same arm across sessions, which keeps the comparison from being contaminated by within-user learning. Hold candidate generation and popularity-score versions identical across arms. If the treatment arm also ships a new retrieval model or a rescored popularity prior, you have measured the bundle, not the reranking policy, and the result is uninterpretable.
Pre-register two things before you look at outcomes. First, independent-view-share lift as the exposure objective — the share of actually viewed top-10 results belonging to independents, not the share of slots. Second, aggregate restaurant-detail click-through rate as the relevance guardrail, with a non-inferiority margin justified by business tolerance rather than by whatever the data happens to show. Specify the statistical uncertainty you will accept — the confidence-interval width, the minimum detectable effect — in advance. A guardrail chosen after the fact is not a guardrail.
Sponsored restaurant placements are a separate inventory class. Either hold their positions constant across arms or exclude them consistently from the organic-ranking evaluation. If ad load shifts between arms, a cap can appear to win because paid inventory moved, not because organic reranking helped independents.
One edge case worth naming: a click-through dip inside the predeclared margin is not evidence that diners prefer chains. It is a composition shift or noise, and reading preference into it repeats the same error as reading discovery into slot counts.
| Policy | Exposure control | Main weakness | Decision |
|---|---|---|---|
| Popularity-only ordering | No explicit chain-brand limit | Historical engagement can concentrate visibility | Retain when the cap has not passed evaluation |
| Fixed independent quota | Reserves positions by merchant category | Can force weak matches when eligible supply is thin | Reject as the default |
| Relevance-qualified chain-brand cap | Limits repeated brands within eligible candidates | Can redistribute exposure without benefiting independents | WINNER only after the exposure and click guardrails pass |
Before shipping any cap, publish three artifacts: the pre-registration with its margin and uncertainty, the cap-strength derivation from the repeated-brand distribution, and the sponsored-placement handling. If any of the three is missing, retain popularity-only ordering.
What the Data Doesn't Tell You
A cap can pass an aggregate test without earning a universal deployment claim. The cited research does not supply a randomized estimate of this chain-brand-cap policy’s effect on independent restaurants’ share of actually viewed top-10 results and restaurant-detail click-through rate (CTR). No universal cap uplift is justified. The date on this guide does not refresh older evidence: its applicability still depends on the queries, restaurant inventory, and ranking environment it examined.
Explicit brand intent is a useful counterexample. Consider a hypothetical query for “McDonald’s near me.” Additional McDonald’s locations may be relevant alternatives because their distance, opening hours, or available services differ. Suppressing them can remove choices the diner specifically requested, even if the same cap benefits an unbranded dinner search. Relevance qualification must account for the requested brand, not merely whether a replacement serves similar food. An aggregate CTR decline therefore does not establish that diners generally prefer chains; it could reflect a mismatch concentrated in brand-specific queries.
Neighborhood and daypart define the available substitution set. In a late-night district with few open, eligible independents, a cap may have no independent exposure benefit because suitable replacements are absent. A dense dinner market may offer many substitutes. Neither outcome licenses an inference about the other, and a citywide average can conceal both. The useful diagnostic is to examine neighborhood-by-daypart results alongside eligible independent availability. Pooling all evening traffic, for example, can obscure the difference between a ranking constraint and a supply constraint.
These distinctions also limit what a favorable aggregate comparison establishes. Separate broad discovery from explicit brand searches, and distinguish substitution-rich contexts from substitution-poor ones before interpreting the result. Sparse subgroup estimates should remain uncertain rather than becoming confident local deployment claims. A relevance-qualified cap is justified only for a deployment scope supported by randomized evidence of higher independent view share and CTR within the predeclared non-inferiority margin; otherwise popularity-only ranking remains the default.
Restaurant-detail clicks are a behavioral guardrail, not a commercial outcome. A click can represent useful consideration, comparison shopping, or an unsuccessful attempt to resolve missing information. It does not establish a reservation or completed order, much less contribution margin or merchant survival. Even a cap that clears the click guardrail leaves those downstream consequences uncertain. Without linked downstream measurement, the defensible conclusion stops at exposure and click performance—not increased restaurant revenue or a healthier independent sector.
Finally, the experimental environment can respond to the treatment. Restaurants may change opening hours, listing quality, promotions, or participation; diners may learn where preferred choices now appear. Merchant changes affecting both experimental arms can create interference, so the contrast may differ from a full rollout. Changes caused by the cap are potential policy effects, not automatically noise to remove. Record when these adjustments occur and inspect whether effects persist across the experiment rather than relying solely on its pooled estimate. Short-run randomization can identify an effect under the tested conditions without identifying the durable equilibrium after merchants and diners adapt.
Worked Audit
According to Michael Anderson and Jeremy Magruder's 2012 Economic Journal paper, "Learning from the Crowd: Regression Discontinuity Estimates of the Effects of an Online Review Database," a half-star rating increase raises sell-out probability by 19 percentage points, which the authors report as a 49% increase. Back-solving that reported pair is instructive and also a trap: 0.19 ÷ 0.49 ≈ 38.8% implies a baseline sell-out probability, and 38.8% + 19 points ≈ 57.8% implies the treated level. Both figures are probabilities implied by rounded reported effects, not reconstructed raw observations. Use them as a check on how a headline effect decomposes, never as a substitute for the underlying data.
Now the audit itself. What follows is an explicitly illustrative restaurant-ranking audit — not a published cap experiment, not a field trial. Each arm records 10,000 qualifying viewed cards. Under popularity ordering, 3,000 of those cards are independent restaurants; under the cap, 4,200 are. That is an independent view share of 30% versus 42%, an increase of 12 percentage points. This is the exposure gain the decision rule asks about, and it is the only thing the audit has established so far.
Click behavior is measured separately. The control arm logs 900 clicked impressions and the treatment arm 910, against the same 10,000 qualifying cards per arm. Aggregate restaurant-detail CTR is therefore 9.00% versus 9.10%, a difference of +0.10 percentage points. Note what did not happen: the published sell-out effect from Anderson and Magruder was not imported into either click count. Sell-out probability and detail-page CTR are different quantities measured on different populations, and blending them would manufacture a result the audit never produced.
Apply an illustrative predeclared non-inferiority margin of 0.50 percentage points. Under a deliberately simplified independent-impression normal approximation — treating each card as an independent Bernoulli trial, which the production analysis must not do — the standard error of the CTR difference is about 0.406 percentage points. The one-sided 95% lower bound is therefore approximately −0.567 percentage points. The click guardrail is not established: the bound crosses the allowed loss.
The worked decision is to retain the control despite the exposure gain. This is where the common myth breaks. The guardrail failed even though CTR rose slightly, so nothing here supports reading the result as diners preferring chains — the failure is an uncertainty bound, not a preference signal. A cap that lifts independent view share by 12 points but cannot rule out a 0.567-point CTR loss has not met the predeclared bar. Two requirements follow for production: the analysis must account for repeated observations within diners, since one diner viewing many cards violates the independence assumption above, and the entire ranking calculation must be labeled synthetic so no reader mistakes it for field evidence.
| Audit metric | Control (popularity) | Cap | Difference |
|---|---|---|---|
| Qualifying viewed cards | 10,000 | 10,000 | 0 |
| Independent-card views | 3,000 | 4,200 | +1,200 |
| Independent view share | 30% | 42% | +12 pp |
| Clicked impressions | 900 | 910 | +10 |
| Restaurant-detail CTR | 9.00% | 9.10% | +0.10 pp |
| Guardrail verdict | Reference arm | Not established | Lower bound −0.567 pp vs −0.50 pp margin |
How to Choose Well
A cap can win the aggregate comparison and still be the wrong policy to ship. Approval requires a relevance-qualified cap to demonstrate higher independent-restaurant share of actually viewed results in the evaluated leading-results window, with restaurant-detail CTR inside the predeclared non-inferiority margin. The checks below can veto that approval; none can substitute for it. Otherwise, popularity-only ranking remains the choice.
Keep the approval criteria separate: ownership-label reliability, independent-card response, confirmatory validity, operational value, and rollback eligibility answer different questions. Passing one does not compensate for failing another. In particular, acceptable aggregate CTR cannot turn unresponsive independent exposure into useful discovery. The supplied evidence establishes no numerical thresholds for these checks; use the values declared in the evaluation protocol, not values reverse-engineered from its results.
Rule one — If unresolved ownership classifications exceed the predeclared data-quality allowance, postpone the policy choice and leave popularity-only ranking in place. Compare the unresolved count or rate with the allowance using its declared denominator; do not silently change that denominator by excluding difficult merchants. Resolve the audit before interpreting the exposure objective. An uncertain ownership label makes the measured independent share uninterpretable, rather than merely making the cap look less convincing.
Rule two — If independent-card CTR breaches the separately predeclared merchant-discovery floor, do not approve the cap, even when aggregate restaurant-detail CTR satisfies non-inferiority. Use the independent-card metric and population specified before the comparison. Aggregate performance can conceal an unacceptable response on the cards receiving additional exposure. If that floor was never declared, do not manufacture a passing threshold afterward; establish it before a fresh approval evaluation.
Rule three — If success appears only after choosing favorable cities, cuisines, or cap strengths, retain popularity-only ranking for that proposed deployment until a fresh randomized confirmatory sample validates the selected configuration. For example, a hypothetical Chicago-only success discovered while searching city results is a candidate for confirmation, not evidence authorizing Chicago rollout. Freeze the selected population, cap strength, and acceptance criteria before collecting the confirmatory sample; otherwise, selection simply moves into another round.
Rule four — If the measured independent-view-share gain falls below the predeclared minimum operationally worthwhile gain, retain the simpler popularity-only control even when the statistical test reports significance. Compare the effect with that threshold in the declared exposure units, rather than switching between absolute and relative gains after seeing the result. Statistical detectability does not establish sufficient operational value. Clearing this threshold still requires passing the randomized exposure and CTR criteria, not merely producing a small p-value.
Rule five — If an approved cap crosses a predeclared rollback boundary during monitoring, restore popularity-only ranking for the affected restaurant-search population. Apply the boundary’s specified measurement window and population rather than improvising exceptions after deterioration appears. Retain the cap elsewhere only where its evaluation remains valid; an unaffected aggregate is not permission to ignore a failing segment. If the failure undermines shared ownership labels or measurement, reassess whether the supposedly unaffected populations still have valid approval evidence.
What to do next
| Step | Action | Why it matters |
|---|---|---|
| 1 | Separate Matador Network’s Yelp-based rankings and Orbital’s Google-review growth from measured search-result views and clicks. | Ratings, review growth, and independent-restaurant placements do not establish exposure gains. |
| 2 | Use Google Business Profile Help’s relevance, distance, and prominence framework to define eligible results; restrict any chain-brand cap to relevance-qualified restaurants. | Limiting repeated brands must not substitute for matching the diner’s search. |
| 3 | Instrument independent-restaurant view share and restaurant-detail click-through; predeclare the click-through non-inferiority margin before testing. | Even a hypothetical 25% relative visibility gain cannot excuse diner response falling outside the guardrail. |
| 4 | Run a randomized comparison of popularity-only ranking, exposure-aware reranking, and a relevance-qualified chain-brand cap over a proposed 90 days. | Directly measured views and clicks test the policies; the suggested duration is not a finding from Matador Network or Orbital. |
| 5 | Choose the relevance-qualified chain-brand cap only if randomization demonstrates higher independent-restaurant view share and click-through within the predeclared margin; otherwise retain popularity-only ranking. | Caps are conditionally admissible, not a default fairness intervention. |
Frequently Asked Questions
How long is the proposed test window for comparing popularity-only ranking, exposure-aware reranking, and brand caps?
A proposed evaluation lasting 90 days could compare these policies using independent-restaurant view share and click-through rates, with a predefined guardrail against materially weaker diner response.
What exactly goes into the denominator of independent top-10 view share?
Independent top-10 view share equals qualifying viewed independent cards divided by all qualifying viewed restaurant cards in positions 1–10, and chain and unknown cards both remain in the denominator.
When does a restaurant card count as viewed for the exposure metric?
Before assignment, fix the minimum visible fraction of a card and the uninterrupted visibility duration required for qualification identically across arms, with a rendered card below the fold not qualifying without scrolling into view and an initially visible card able to qualify without scrolling.
When does the brand cap win in this guide’s comparison?
For this guide’s comparison, the cap wins only when randomization demonstrates increased independent-restaurant view share while restaurant-detail click-through remains within a predeclared non-inferiority margin; otherwise, popularity-only ranking remains the choice.
How does the guide define an independent restaurant for ownership labels?
According to Matador Network, independent restaurants are non-franchise or non-chain businesses that are locally owned and operated or family owned and operated, and qualifying local or family ownership must coexist with neither chain nor franchise affiliation.
What did Luca’s Yelp research find about the revenue effect of a one-star rating increase?
According to Luca, a one-star increase in Yelp rating produces an estimated 5–9% increase in restaurant revenue, but the estimated rating effect is driven by independent restaurants and is not detected for chain-affiliated restaurants.
Quick answers
| What are the three policy choices? | The policy choices are popularity-based ranking as a baseline, exposure-aware reranking that accounts for independent visibility, and limits on repeated chain brands. |
| When is a cap defensible? | A cap is defensible only if measured independent visibility improves while diner response remains within that guardrail. |
| What could a proposed evaluation lasting 90 days compare? | A proposed evaluation lasting 90 days could compare these policies using independent-restaurant view share and click-through rates, with a predefined guardrail against materially weaker diner response. |
| What does independent top-10 view share equal? | Independent top-10 view share equals qualifying viewed independent cards divided by all qualifying viewed restaurant cards in positions 1–10. |
| What do local results depend mainly on according to Google Business Profile Help? | According to Google Business Profile Help’s “Tips to improve your local ranking on Google,” local results depend mainly on relevance, distance, and prominence. |